Monday, April 11, 2011
Wednesday, March 16, 2011
Final Project

1. Introduction
This study examines the risk areas of potential wildfires in Los Angeles County. A Geographic Information System was used to determine areas that are both low in precipitation and high in fuel loads. Environments that are prone to fire are so largely because of three components. The fuel which is the potential vegetation that is at risk of being burned—included is how dry it is and how much there is (fuel load); The weather component, which is mainly attributed to the precipitation in a given area; and the third component is the topography, which is the slope and terrain and barriers. Fuel loads are very influential in determining and understanding potential fire zones, how long they could potentially burn for. The amount of vegetation is the major factor in determining fuel load as well as the dryness of the vegetation. The fuel Load has a major impact in terms of determining the intensity of the fire and how difficult the fire is going to be to control if the area were to burn (Keeley et al 1999). Weather is another key component that greatly affects the potential risk of a wildfire. Meteorologists and climatologists aided with recent technological advancements in remote sensing technologies are working on and studying new ways to understand our atmosphere and local weather systems to determine that future fire risk will increase with climate change (Cheeney, 1993). The effect of rainfall has to dampen the fuel largely depends on the size of the fuel; fine fuels absorb moisture more quickly than coarse fuels. Lack of precipitation is the most significant factor in contributing to the reduction of moisture levels in fuels (Keeley et al 1999). The effect of topography on rural fires can be significant, with slope being the most critical component. The slope can actually help accelerate the rate of the fire (Keeley et al 1999).
2. Methods
2.1 Study Area
The study area of Los Angeles County located between 34° 3′ 0″ N latitude, 118° 15′ 0″ W Longitude (fig . 1) has a total land area of 4,083 sq mi and peak elevation of 10,068 ft. The county is divided west-to-east by the rugged San Gabriel Mountains, filled with coniferous forests as well as other diverse vegetation in the surrounding areas that make Los Angeles a unique case study area.
2.2 Precipitation
Precipitation data was obtained from 148 Manually Observed Non-Mechanical Rain Gages, these gages are measured once daily by volunteers and reported monthly. The Data used in the study was obtained from the USGS Beginning on 10-01-2010 and Ending on 03-16-2011 03:38 PM (fig.2). The table was converted to a usable formant and converted to a DBF. In ArcGIS it the gages were plotted and its Total Rainfall values were interpolated using an IDW interpolation to create a county-wide expected rainfall map.
2.3 Fire Fuel
Fire fuel data was extracted from a database of Los Angeles County Fire Department (FRAPS database). The type of fire fuel was not discriminated against and includes both natural vegetation and human constructed fuel. The fuel data was masked to only fit the Los Angeles County boundary.
2.4 Elevation/ Topography
Elevation data for Los Angeles County was obtained from the USGS Seamless Server as a raw 30m by 30m with a UTM coordinate system Digital Elevation Model. The DEM was converted to a Hillshade in ArcMap where it served as the underlying layer of the map.
2.5 Map Points.
A list of fire stations was obtained from the Los Angeles Fire Department locator website. These addresses were compiled into a spreadsheet (fig. 3 ) were they were geocoded to the LA County Streets Layer. In order to properly geocode the points, and address locator and geodatase were constructed from the Streets Layer using ArcMap. Note that the Street Layer is not visible. The hospital and recreation points were used from the Los Angeles county Enterprise GIS Database and were simply overlaid unedited.
The Projected Development layer was used from the FRAPS database and is used to represent areas of current and potential development by the year 2040. Development includes but housing and industrial. The Significant Ecological Area layer was obtained from the Enterprise GIS Data base and projected unedited.
1.1 Spatial Analysis
The Rain gages were interpolated using an IDW interpolation from 148 data point gages sensing total rainfall. The interpolation was in GRID formant with 32 Bit pixel Depth in WGS 1984 coordinate system. The Fuel Rank Layer was in both a different coordinate system as well as a different pixel size. The Fuel Layer was converted to match the interpolation layer pixel size. In the Raster Calculator the two layers were merged using a weighted average. Because this case study is looking for lack of rain instead of total rain, it was multiplied by (-.4) while the fuel rank was multiplied by (.7) giving more weight to the fuel than the rain (Fig 4).
A 3 mile buffer was given to the fire station point because 15 min is the estimated response time needed contain a fire before it gets out of control and 3 miles of travel takes roughly 15 minutes depending on the terrain traveled (FRAPS). A hillshade was under-laid to give the map texture and show points of high elevation that may be difficult to get to or increase the acceleration of the fire.
Results
Using the map that I created I found it appropriate to focus in on certain areas that I felt needed to be protected from fire Hazards. The area focused in on The Malibu- Encino area (West of the 405 Highway) shows many Significant Ecological Areas. There are two areas that are in Hazardous areas and not within 3 miles a fire station. The area in the middle of scene is comprised of the Encino Resivior and Temescal- Rustic- Sullivan Canyons. The Area on the left of the scene is comprised of Zuma Canyon, Upper LA Sierra Canyon, and Buffers 3A and 3B.
The scene on the map that depicts the North-East region of the county shows an area that is not at risk of a potential hazard because it is a zone that has neither low precipitation nor is it rich in fire fuel. There is a layer of Projected Growth overlaid on the hazard map that depicts an estimated growth in populated areas by the year 2040 based on recent census data. In this scene of projected development there is an area that currently lacks any fire station or hospital in a 9 mile radius.
Conclusion/ Discussion
This study shows that a Geospatial Information System is crucial to both protecting current endangered habitats as well as highlighting areas that are safe for future developments from wildfire hazards. The Hazard map is weighted to give stronger consideration to the fuel of the fire because no matter how little precipitation there is, there cannot be a fire if there is nothing to burn. The Vegetation in California is typically dry and conducive to burning, but will have a less chance of burning if it is a wet season because the vegetation will be healthier.
The Study area of the Malibu-Encino region shows that there is not fire station within a 5 mile area of the Temescal- Rustic- Sullivan Canyons. This is a practically important area because the North end of the canyon is owned by SoCal Gas to run a natural gas pipeline to more developed areas of Brentwood and Malibu. The rest of the Ecological zone is Sullivan Park owned by the state. The reason for the high fuel load is due the abundance of Sycamore trees which are known for their commercial use as fire wood. If there were to be a fire that reached a leaky pipe, the results could be disastrous. Just above the Sulivan Canyon is the Encino Resivior, I propose a fire station just the north in Encino city should be built to capitalize on the Reservoir’s water supply. If there were a fire the reservoir could be used by helicopters and planes to suppress the fire.
The Projected growth study are consists mainly of Palmdale and Unincorporated Los Angeles. These areas did see an increase in population up until the current recession, but have since taken a hit. The reason these areas remain largely uninhabited despite their lack of fire risk is because they also lack the other resources that make areas habitable. If future development were to occur, there would need to be more hospitals built, especially near the lone recreation site.
On the scene that shows the entire Los Angeles County, the part that sticks out the clearest in in the Mid-East of the county. This area was the source of the Los Angeles Station Wildfire that consumed much of Los Angeles in 2007. This area is largely forested and high in elevation so it is depicted as Red. Most of this area is state-owned with little development, but there are people on the outlying parts of the forestry extent.
There is still further GIS analysis that could be done with this study, most notably including wind data and well as history of seasons could be applied. With the addition of that information, we would have a more complete fire hazard map.
Sources:
Keeley, Jon E, and C J. Fotheringham. "Historic Fire Regime in Southern California Shrublands." Conservation Biology. 15.6 (1999): 1536-1548. Print.
Keeley, Jon E, and C J. Fotheringham. "History and Management of Crown-Fire Ecosystems: a Summary and Response." Conservation Biology. 15.6 (1999): 1561-1567. Print.
California Department of Forestry and Fire Protection's Fire and Resource Assessment Program (FRAP)
Los Angeles County Enterprise GIS
UCLA Mapshare
USGS Seamless Server
USGS Hydrology
Tuesday, March 1, 2011
Interpolation
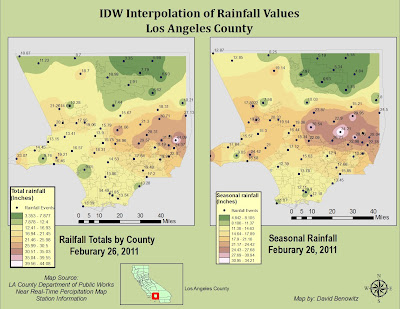
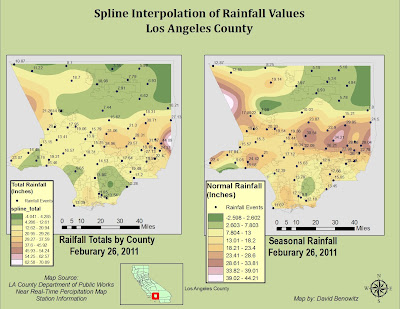
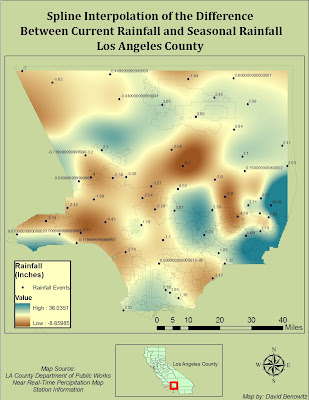
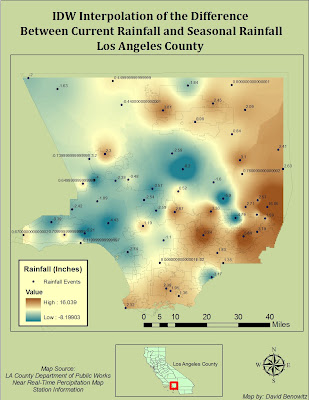
I started out the assignment by converting the degrees, minutes, and seconds of the location of each “Rain Sensor” to decimal degrees and determined the difference between seasonal Normal Rainfall and Current Total precipitations in Los Angeles County. I converted the Excel file to a database frame and projected the .dbf as XY data onto the polygon of Los Angeles County, both in the NA 1983 Datum Geographic Coordinate System. I then used spatial analyst to create Spline and IDW models of the Total and Normal interpolations, as well as the differences between them two especial in the San Gabriel Mountains in the North of LA County.
The interpolation of the rainfall of Los Angeles County are both revealing and intriguing. These rainfall patterns are show that the rainfall is pretty evenly distributed across LA County with one area of concentration of strong rainfall is the East, and weak rainfall in the North. The map showing the differences between the Total Rainfall and the Normal Rainfall shows that there are discrepancies between the two. There are also differences between the two that can clearly be seen in the maps.
I chose IDW and Spline interpolations because they are more accurate than Kriging on the local scale. They are also both efficient at estimating unknown points, which I felt was useful because I only used about 60 of the counties to build my interpolation. Because rainfall is so precisely tied to proximity in terms of regions, I felt IDW would be an accurate representation as well due to its function of interpolating points based on its distance Values. Spline interpolation has the ability to calculate exact surfaces for continuous temperature data which I felt helped in appropriately showing continuous rainfall throughout the county.
Tuesday, February 22, 2011
Lab 6
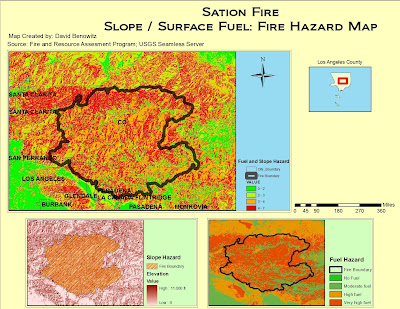
Dealing with raster spatial analysis, I learned very quickly that it has its own set of pitfalls that differ from vector data. With patience and focus I was able to apply the techniques from the tutorial to the analysis of the Station Fire in California. The process for me began with acquiring the data, which meant planning ahead. It was important to me to gather shapefiles from a common source in order to avoid any irregularities in their respective projections. In addition to downloading county, city boundary, and fuel shapefiles I had to acquire my own raster hill shade in order to create a slope. The most important methods that I had to implement were raster clipping of the hillshade, analysis masking and reclassification of the slope and fuel layers in order to create a presentable Hazard Map.
This lab illustrated the differences and the importance of being able to work with both vector and raster data on the same plane. You have to employ different modes of thinking when dealing with the two, and always make sure that your two forms of data are compatible with each other for the final combination of data. I had my own troubles with reclassifying the slope with spatial analysis as well as merging it with the fuel layer. The process of masking the layers to the county shapefile was also difficult for me. By working through these difficulties I was able to better understand the processes behind these techniques.
Although I had a few missteps along the way, I believe my map is quite clear in demonstrating the hazards within and around the Station Fire perimeter. I found that once I became more comfortable in dealing with raster data, the more possibilities I can see with working with it. Because raster data is likely a real world image, the results you gain from it are real world results. I realize that hazard maps are just a small portion of the potential of raster data. I will continue to use raster data in the future in order to paint a real world picture that many can relate to and understand.Tuesday, February 15, 2011
Lab 5

There is a strong controversy coming from the small city of Kettleman in the San Joaquin Valley due to its proximity to a waste management and the possible health risks that come from it. These controversies related to the landfill project can be clarified through research, government transparency, and GIS techniques. With a focus on GIS we can gather information on issues ranging from pollution, recent birth defects, and safe work environments due to the proximity of the landfill to the city. The Waste Management Co. has made a proposal to the city legislature to make a major expansion and the denizens of the surrounding cities are not yet comfortable with this until the proper research and scientific testing is done from sources that they can trust in order to insure the future safety of the surrounding area. GIS can be a valuable tool in helping answer the questions in what is safe and fair to the surrounding cities while still gainful for the Waste Management Co.
The principal complaint from the people of the surrounding area is that they cannot trust the investigations that have taken place. Kettleman City residents feel there needs to be proper attention and investigation into the claims that that their proximity to the landfill has led to an unusual spike in birth defects in their city and surrounding area. The Kings County Department of Public Health claims "that the extent that a cluster [of birth defects] may exist, it is most likely a random event unrelated to any environmental exposure unique to Kettleman City." They citizens themselves don’t buy it; additional research from the State of California would help ease their minds.
Unfortunately, this has not been the case. The studies that have been conducted by the California Birth Defects Monitoring Program concluded that they could find no link between the site’s proximity to the city and the birth defects of the people. This study too has not been fully accepted by the citizens. The people believe that the methods used to test for such a link is flawed and do not trust the research over their anecdotal evidence of what they see in their neighborhoods. There is a fundamental breakdown in trust between the people of the city and the legislatures that are supposed to represent the people, therefore the people cannot comfortably put the health of them and their children into the government’s hands. With the clear data that GIS can potential provide the public will be more willing to accept the decisions of their local government.
GIS can help inform the public and local government about what is happening in proximity to the landfill based on a variety of factors. But GIS is based on the raw data you build from so the GIS research would have to be in conjunction with other credible research programs that would have no interest in the landfills expansion such as the EPA and California Department of Health and Safety. The techniques in this exercise can present a clear finding to the public that they can trust as well as be used by researchers to determine if expansion is safe or not.
This exercise is very useful in determining the suitably of the site. There are some problems that hinder the suitability analysis in expanding the landfill. The importance of one factor over another is not a finite measurement but rather a social construction that further fuels the debate. The subjective nature of the factors that go into determining the appropriation of the expansion can even further be hindered by the “NIMBY” stance of the residence which no amount of research, data, or GIS can overcome.
Wednesday, February 2, 2011
Quiz 1
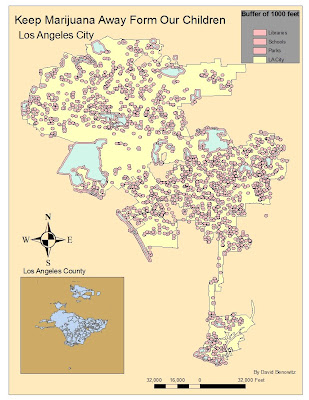
My map supports the government decision to put a 1000 foot buffer for marijuana dispensaries from schools, libraries and parks. I don't believe they should be legal at all let alone near our children to influence them. The exposure to such drugs could have significant long term effects on our youth in the future.
Some argue that marijuana dispensaries can bring in revenue to our city. Although our city is in a financial crisis, this is not the answer. But having a marijuana dispensary could also hurt other local businesses.
We must protect our youth so they can lead us in the future. There are still plenty of areas that these dispensaries could set-up, and they are probably more desirable locations for them anyways, such as Downtown Los Angeles. You can see these corridors as blank space on the map.
Friday, January 28, 2011
Tuesday, January 25, 2011
week 3
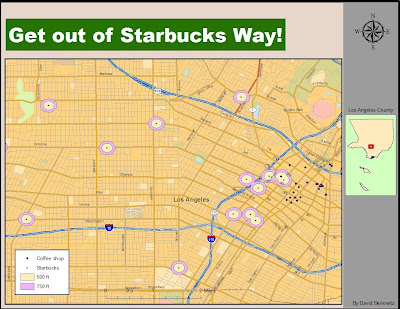
Geocoding is is the process of expressing point-coordinate features on a map by associating it with a street address or intersection. Geocoding is a very popular feature that is used by millions everyday in Google Maps and Places as well as Bing Maps to locate any address or landmark throughout the world. I thought I would take my project further by providing an analysis to the points I plotted.
 I started out by doing a simple Google Maps search to find every Starbucks Coffee in the Downtown Los Angeles. I used this information to create a my own address database. I repeated this process with "Non-Starbucks" coffee shops. I then geocoded the address database to the Streets layer of the StreetMap USA file and matched any nonconecting addresses. I then buffered the Starbucks with 500 ft and 750 ft.
My data solidifies the theory that Starbucks will not build a new store unless it is far enough away from competing coffee shops as well as have the ability to control a certain area's coffee needs. Downtown Los Angeles in one of the only truly compact areas in Los Angeles County, and you can see that "Non-Starbucks" coffee shops are compacted in a cluster while Starbucks is spread out with little outside competition. The 500 ft and 750 ft buffer represents a walking distance area of a Starbucks, and you can see that there is few competing coffee shops in walking distance from a Starbucks.


