
Friday, January 28, 2011
Tuesday, January 25, 2011
week 3

Geocoding is is the process of expressing point-coordinate features on a map by associating it with a street address or intersection. Geocoding is a very popular feature that is used by millions everyday in Google Maps and Places as well as Bing Maps to locate any address or landmark throughout the world. I thought I would take my project further by providing an analysis to the points I plotted.
 I started out by doing a simple Google Maps search to find every Starbucks Coffee in the Downtown Los Angeles. I used this information to create a my own address database. I repeated this process with "Non-Starbucks" coffee shops. I then geocoded the address database to the Streets layer of the StreetMap USA file and matched any nonconecting addresses. I then buffered the Starbucks with 500 ft and 750 ft.
My data solidifies the theory that Starbucks will not build a new store unless it is far enough away from competing coffee shops as well as have the ability to control a certain area's coffee needs. Downtown Los Angeles in one of the only truly compact areas in Los Angeles County, and you can see that "Non-Starbucks" coffee shops are compacted in a cluster while Starbucks is spread out with little outside competition. The 500 ft and 750 ft buffer represents a walking distance area of a Starbucks, and you can see that there is few competing coffee shops in walking distance from a Starbucks.
Tuesday, January 18, 2011

Tuesday, January 11, 2011

Wednesday, June 2, 2010
Week 9
The series of maps presented below is from data based on the U.S. Census Bureau collected during the 2000 Census. With this data we see that there is a degree of spatial autocorrelation in all three maps, showing that there is a relationship between ethnicity and real estate. The maps broadly reveal that Asian-Americans are concentrated on the coasts; African-Americans live mostly in the South; “Some Other Race,” is largely synonymous with Hispanic reside primarily in the West, particularly in the Southwest and California.


There are large, burgeoning populations of Asian-Americans in San Francisco, Seattle, and New York. This began during the the 19th century when many Asians began to settle there before the iimplementation of a quota system in 1924. The use of a quota system for immigration was removed in 1965, since then Asians have migrated to large metropolitan cities and suburbs. Within these cites Asians tend to create their own communities leading to sprouting Japantowns, Koreatowns, and Chinatowns. You can see that a heavy settlement on the West Coast is a direct result of geography: many Chinese and Japanese immigrants came by boat in the 1900s across the Pacific Ocean to the other side of the Pacific Rim. Asian Americans have the lowest poverty rate, the highest educational attainment levels, and median personal income of any racial demographic in the country.

There are approximately 37 million Blacks in the U.S., the second largest minority in the country. African-Americans have have strong concentrations in the South; from Virginia down through the Gulf Coast to eastern Texas. In these areas there are high degrees of poverty, undereducation, and high crime rates. Almost all of the African-Americans are descendants of the Columbian Exchange.

The “Some Other Race” category aggregates all people whose responses did not fall into the categories of “”White”, “Black or African American”, “American Indian and Alaska Native”, “Asian” and “Native Hawaiian and Other Pacific Islander” [1].

There are large, burgeoning populations of Asian-Americans in San Francisco, Seattle, and New York. This began during the the 19th century when many Asians began to settle there before the iimplementation of a quota system in 1924. The use of a quota system for immigration was removed in 1965, since then Asians have migrated to large metropolitan cities and suburbs. Within these cites Asians tend to create their own communities leading to sprouting Japantowns, Koreatowns, and Chinatowns. You can see that a heavy settlement on the West Coast is a direct result of geography: many Chinese and Japanese immigrants came by boat in the 1900s across the Pacific Ocean to the other side of the Pacific Rim. Asian Americans have the lowest poverty rate, the highest educational attainment levels, and median personal income of any racial demographic in the country.

Works Cited
[1] “Census Quick Facts,” US Census Bureau
[2] “Some Other Race,” US Census Bureau
Sunday, May 23, 2010
Week 8: Cartography & Geovisualizaton
A massive fire broke out in Los Angeles National Forest on August 26, 2009. The fire was dubbed the “Station Fire” by the media because of its proximity to Mount Wilson, on top of which sits radio and television transmission towers.
Firefighters were able to completely contain the blaze October 16. The fire burned a total of 160,000 acres, the 10th largest in California state history (CDFFP). Mostly fires in S. California are grassland fires,but the Station Fire was a true forest fire, as it burned primarily in the wooded hills of the Los Angeles National Forest (InciWeb). The flames threatened many homes in neighborhoods like La Canada, Flintridge, and Glendale (St. Fire info). 10,000 homes were evacuated as a precaution (CNN). In total, 64 structures were destroyed by the fire, and two firefighters were killed(St. Fire info).
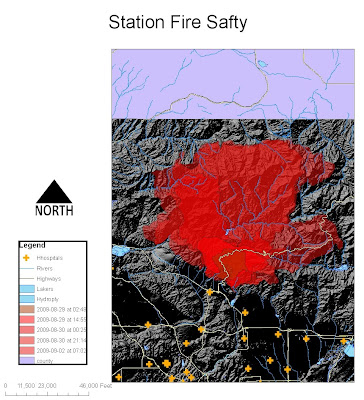
In the first map I aimed to show the spread of the fire from 45,000 acres to 160,000 acres in a few days. I displayed the lakes and rivers of the near-by area in hopes of displaying the possibilities of firefighters using this recourse to put-out the fire. I wanted to show how the rivers were unfortunately not able to contain the fires from spreading in that large over-growth area. Due to the fact that firefighters use helicopters to suck-up water to try and “rain-down” on the fire, I displayed the lakes in that area. A large water source is necessary to fuel these helicopters for easy and safe pick-up. I also displayed the large highways and hospitals in the area. This shows that there are not any roads that are contained within the fire, but if the fire were to go south, there are hospitals that could be used to treat near-by residents.
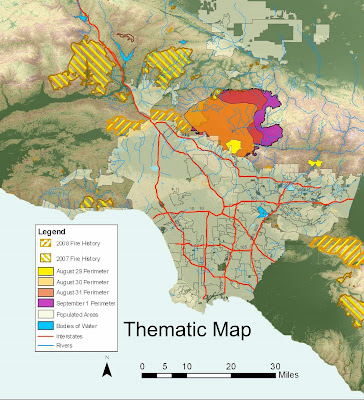
My aim with this map was to show areas of high risk of fire in Los Angeles. I showed the spread of the fire, with the vegetation of the area as well as the County of Los Angeles. The Station Fire broke out in an area where no fires had been for the past two years; there was no fire in the thickly-wooded Angeles National Forest for 62 years (CNN). The fire burned so quickly that it could not be contained. We can see that fires occur in rural areas and are contained before they reach the urbanized floor of the Los Angeles basin. Due to the tendency of fire to burn more efficiently uphill rather that downhill, the people of Los Angeles were very lucky to be below the burn. I also put past fire history to show that they have not recently reached to city, but also begs the question as to whether our policy should shift from containment to letting small fires happen naturally to prevent future large-scale burns.
I believe that my projections of the Station Fire shows the problems with our current fire-control policy in California. Due to the hard-blowing hot Santa Ana winds, the Los Angeles area is always going to be prone to fires. Although the cause of the fire is believed to be arson, better fire-protection is necessary. We need to control the amount of brush in the mountainous areas. This can be done naturally, by allowing fires to happen naturally so that there are often small-scale fires that will allow forest areas to relieve itself of the dead brush naturally; or the manually remove the brush with human intervention. I believe that policy that combines both methods will be the most effective.
Sites:
CAL FIRE
Inciweb
Station fire info
KTLA
Tuesday, May 18, 2010
Week 7

West_Bounding_Coordinate:-119.03249999967
East_Bounding_Coordinate:-118.19916666628
North_Bounding_Coordinate:37.5922222215345
South_Bounding_Coordinate:36.9974999992722
Spatial Reference: GCS North American 1983
Datum: D North American 1983
This is an area of the California mountains. I believe this is an area that is not very populated. I tried, and succeeded, to capture an area in America that has both a strong mountain range and deep valley to show strong topography lines. California rules when it comes to creating maps.
Subscribe to:
Comments (Atom)